55 Fascinating Pet Industry Statistics
This page contains affiliate links. We may earn money or products from the companies mentioned in this post through our independently chosen links, which earn us a commission. Learn More

Modern pet owners think of their furry friends as more than just companions – they’re members of the family. Some even go so far as to buy custom clothing and collars. The pet industry has changed significantly over the years and we have the numbers to show you how.
Check out these fascinating statistics for the pet industry to learn more!
10 Statistics About Pet Ownership
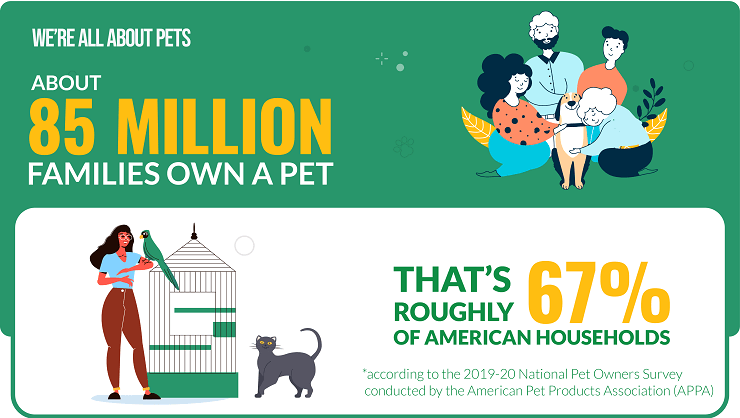
- About 85 million families own a pet. That’s roughly 67% of American households, according to the 2019-20 National Pet Owners Survey conducted by the American Pet Products Association (APPA).
- Pet ownership has increased by 11% since 1988. Previous survey results from 1988 showed only 56% of American households had a pet.
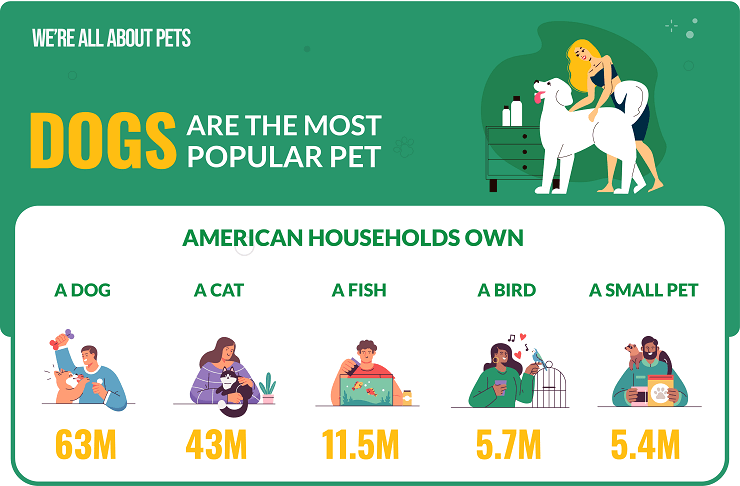
- Fish are the third-most popular pet in the US. After dogs and cats, freshwater fish are the third-most popular pet, owned by 11.5 million American households.
- Birds and small animals are equally popular. Nearly tied for fourth place, about 5.7 million American households have a bird and 5.4 million have a small pet.
- Americans own more cats than dogs. Though APPA statistics show more American households have a dog (63.4 million vs 42.7 million), an estimated 94.2 million cats are owned versus 89.7 million dogs.
- About 40% of pet owners are between 30 and 49 years of age. Millennials and Gen Xers are adopting more pets than older generations.
- Only about 2.1% of pets in the USA are insured. Though pet insurance is becoming increasingly popular, a low percentage of American pet owners actually have pet insurance.
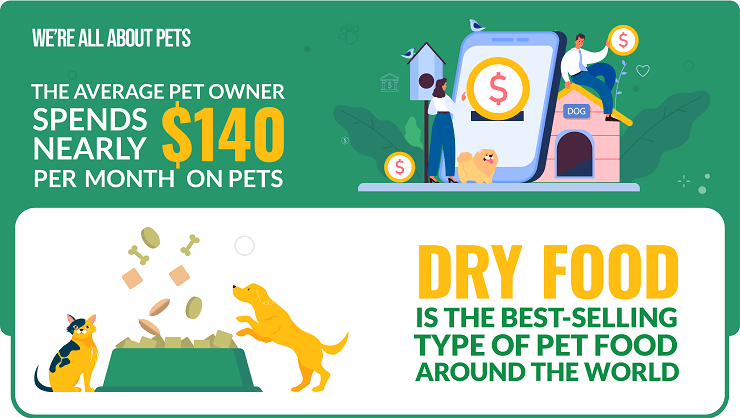
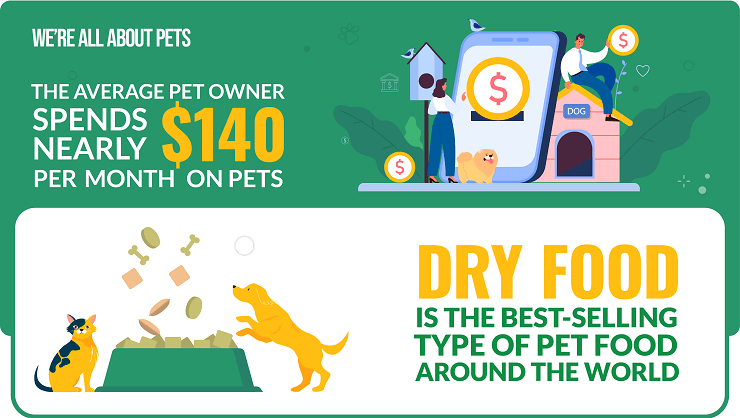
- The average pet owner spends nearly $140 per month on pets. Dogs are typically the most expensive pet to keep, followed by birds and cats. Fish are the most affordable.
- Dogs are the most popular pet. Over 63 million American households own a dog and nearly 43 million households own a cat.
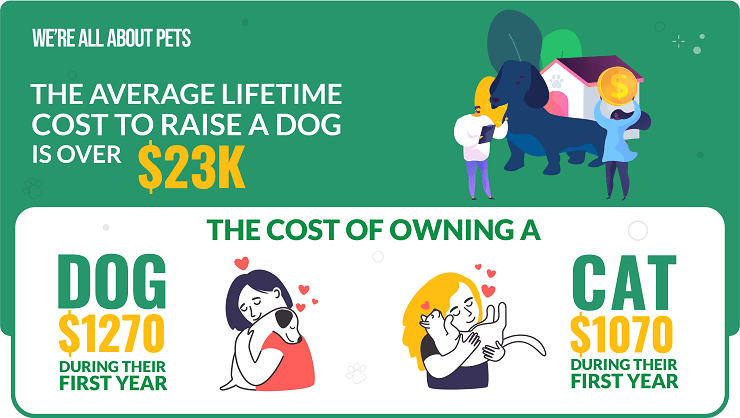
10. The average lifetime cost to raise a dog is over $23k. From adoption to the end of life, the average cost to raise a dog is $23,410.
13 Pet Spending Statistics

- The average surgical visit for a dog is twice as much as a cat. Statistics from the APPA show the average cost for a dog surgical visit is about $426, compared to just $214 for a cat.
- Pet owners spend roughly the same to feed dogs as cats. These same statistics show an average spending of $259 for dog owners each year compared to $228 for cat owners.
- Unsurprisingly, dog owners spend more than cat owners on boarding. The average dog owner spends about $229 per year on boarding compared to just $120 for cat owners.
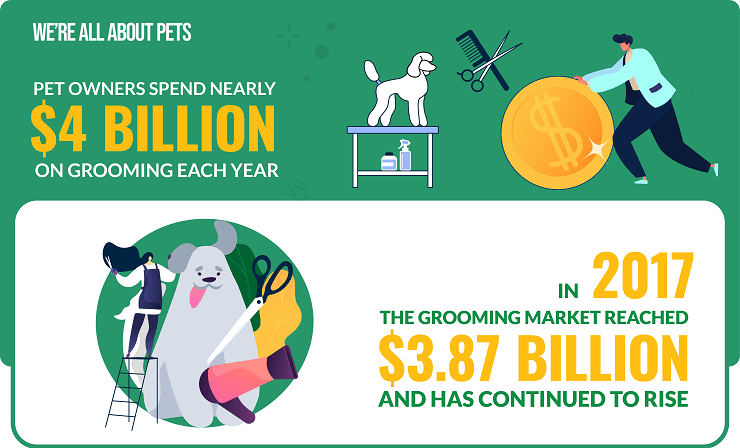
- Pet owners spend nearly $4 billion on grooming each year. In 2017, the grooming market reached $3.87 billion and has continued to rise.
- A new dog owner spends an average of $1,270 during their first year. Though expenses depend heavily on food type and medical expenses, owning a dog isn’t cheap.
- Comparatively, the cost of owning a cat is lower than a dog. The average first-time cat owner spends about $1,070 during their first year.
- Two pet stores – PetSmart and Petco – accounted for over 48% of the total market share in pet industry revenue in 2019.
- Pet owners will spend an estimated $99 billion in 2020. Actual sales in the US market for 2019 were $95.7 billion and were $90.5 billion in 2018.
- Pet food and treats account for the majority of pet spending. In 2019, pet owners spent nearly $37 billion on food and treats.
- Veterinary care and product sales account for over $29 billion in spending. Other supplies, live animal sales, and over-the-counter medicine account for a combined $19 billion and everything else adds up to another $10 billion.
- About 45% of American pet owners spend as much (or more) on their pet’s healthcare as they do on their own. Furthermore, 1 in 10 pet owners put off having kids due to the expense.
- The animal caretaker industry has grown significantly. As of 2019, over 212,000 animal caretakers were employed with an annual wage averaging about $27,000.
- Some pet owners spend over $250 per month on toys. That being said, about $17 of pet owners spend up to $5 a month.
6 Facts About Pet Industry Growth
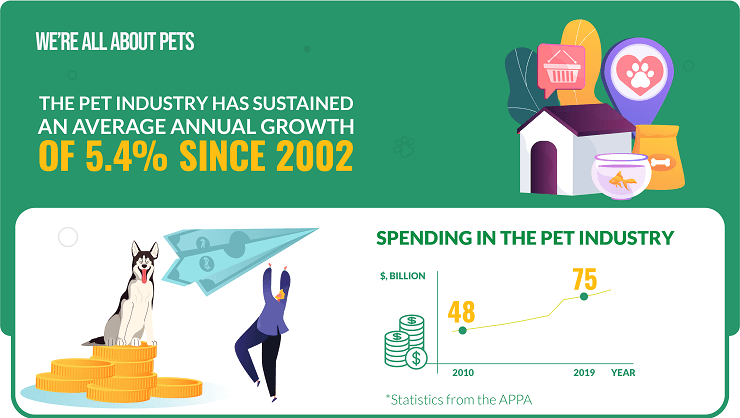
- Pet industry expenditures have increased by over $20 billion in the last decade. According to APPA statistics, spending in the pet industry was just over $48 billion in 2010 and rose to over $75 billion in 2019.
- The pet food market in the US is expected to grow to over $13 billion in the next 3 years. Annual pet food spending was $10.4 billion in 2018 and is expected to grow to $13.3 billion by 2023.
- The global pet grooming industry is nearing $5.5 billion. Allied Market Research indicates global spending for pet grooming was $3.87 in 2017 and it is expected to climb to $5.49 billion by 2024.
- American spending on dog walkers is expected to exceed $1 billion for 2020. The 2019 dog walker market was valued around $1.05 billion and was projected to hit $1.1 billion for 2020, though the pandemic may have affected that number.
- The pet insurance industry grew by 23% from 2017 to 2018. In the US and Canada, pet insurance premiums totaled $1.15 billion in 2017 but rose to $1.42 billion in 2018.
- The pet industry has sustained average annual growth of 5.4% since 2002.
12 Trends in the Pet Industry
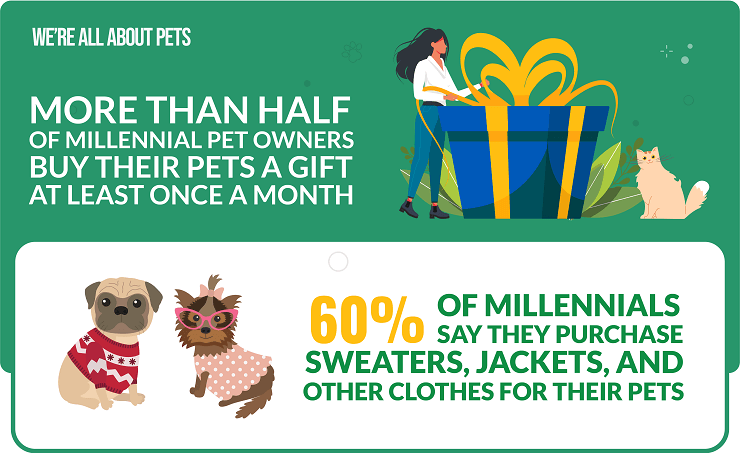
- About 60% of millennials say they purchase sweaters, jackets, and other clothes for their pets.
- Pet food companies are becoming increasingly focused on the public’s interest in proactive, healthy ingredients. Experts expect a rise in products containing nutrients like omega-3 fatty acids.
- The pet humanization trend has a significant impact on growth in the US pet service industry. People consider pets members of the family and more companies are responding to the demand for hotels and restaurants to allow pets.
- Pet insurance is on the rise. According to Nationwide Pet Insurance, more than 2 million pet owners purchased pet insurance in North America in 2017.
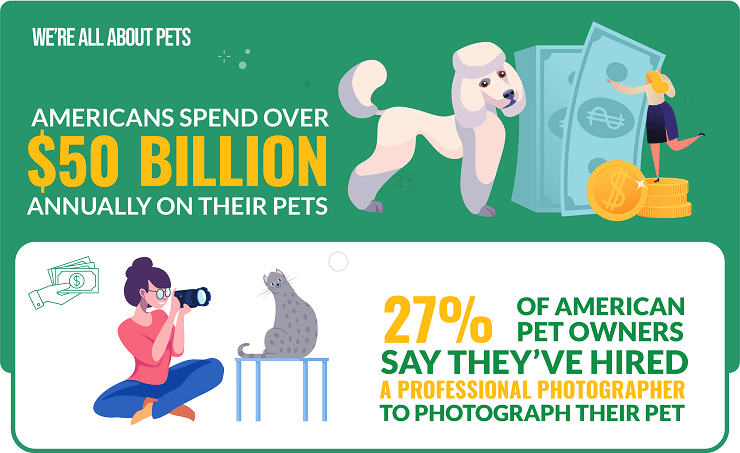
- Americans spend over $50 billion annually on their pets and a lot of that money goes into photography. Apparently 27% of American pet owners say they’ve hired a professional photographer to photograph their pet.
- About 30% of Americans report trying to keep up with the latest pet trends. This applies most to pet clothing and grooming. Pet owners even report trying different types of shampoo to see what works best for their pet’s coat.
- Unfortunately, obesity is a trend in the pet industry. Research suggests more than ½ of all American pets are overweight or obese due to overeating and/or inactivity.
- More than half of Millennial pet owners buy their pets a gift at least once a month.
- Modern pet owners are turning away from traditional pet foods toward healthier options including fresh, frozen, and made-to-order diets.
- Major retailers like Amazon (Wag!) and Chewy.com (American Journey) are disrupting the market by cutting out the middleman to promote their own brands. Even major pet store chains like Petco have created their own brands (Wholehearted).
- End of life services for pets are becoming more popular. This includes palliative services for terminally ill pets as well as grief consulting for pet owners, pet cemeteries, and cremation.
- Direct-to-consumer pet products are breaking the mold. From made-to-order pet foods to custom toys, clothes, and more, pet owners can get high-quality products for their pets without having to through a traditional multi-brand retailer.
14 Other Pet Industry Statistics
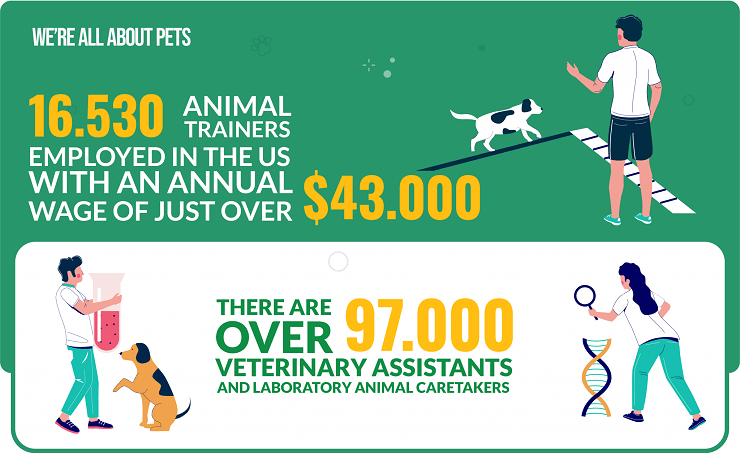
- As of May 2019, there were 16,530 animal trainers employed in the United States with an annual wage of just over $43,000.
- There are over 97,000 veterinary assistants and laboratory animal caretakers. They earn an annual wage around $29,700.
- In 2018, there were nearly 107,000 veterinary technologists, making an average of $35,560 per year.
- Overall pet spending in Europe reached €5 billion in 2018 (about $44 billion USD).
- Dry food is the best-selling type of pet food around the world. Sales for dry dog food reached nearly $35 billion in 2018 and sales in dry cat food rose by 5.5%.
- According to a 2018 report by Grand View Research, the global pet industry is expected to reach nearly $203 billion by the year 2025.
- Only 19% of individuals 21 to 29 years old have pets. The age group with the lowest percentage of pet ownership is 18 to 19 years, around 1%.
- About 43% of pet owners have full-time employment and 11% are employed part-time.
- Roughly 20% of pet owners state their households earn $50k to $75k per year.
- Dogs visit the vet more than cats. Dogs average 1.5 visits per year and cats just 0.7 times.
- The most common reason for dogs being brought to the veterinarian is skin allergies. There were over 140,000 claims in 2019 with an average expense of $255.
- The most common reason for feline veterinary visits is bladder or urinary tract infections. These visits have an average cost of $495.
- Mixed-breed dogs have the most economical insurance premiums. The most expensive dog breed to insure is the boxer, averaging $55 per month.
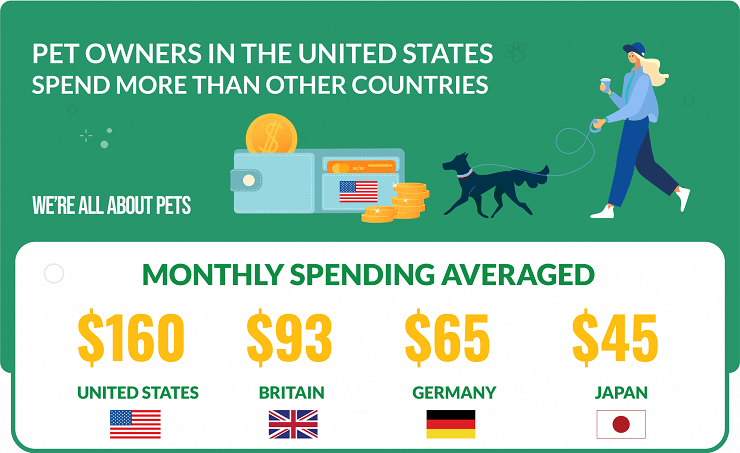
14. Pet owners in the United States spend more than other countries. Monthly spending averaged $160 in the US compared to $93 in Britain, $65 in Germany, and $45 in Japan.
