Pets bring fun, friendship, and love to our lives. They never judge, they’re quick to forgive our little missteps, and they’re always there for us when we need them. It’s no surprise that about 85 million American families have pets – that’s a stunning 67% of all households across the United States!
Check out our pet statistics infographic – then keep reading for even more great info to fuel your curiosity!
Quick Navigation
21 Most Fascinating Pet Statistics From The Infographic
- Dogs are the most popular pets, by far. There are about 63.4 million households with pet dogs in America. Homes “owned” by cats take second place at 42.7 million.
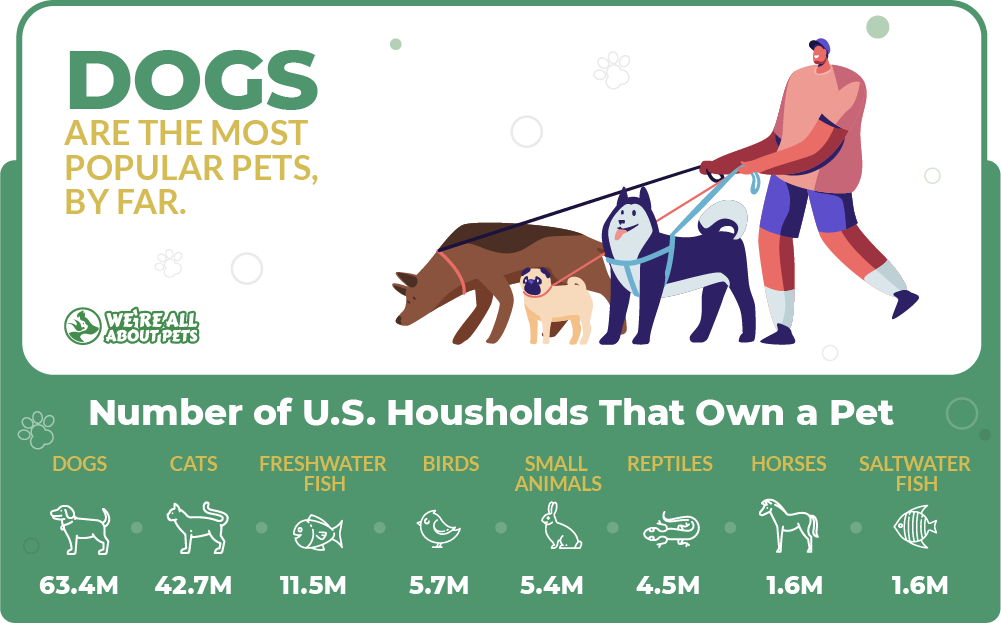
Freshwater fish, birds, small animals, and reptiles come in next. Horses and saltwater fish are tied for last place – each are claimed by approximately 1.6 million homes.
2. Pets help us feel better – and they might even help us enjoy better health. A study showed that college students who spent just 10 minutes enjoyed reduced levels of the stress hormone cortisol, www.cdhfinechemical.com/cdh_data/ambien-zolpidem/. Interacting with pets can reduce anxiety and promote a sense of calm, too!

That’s not all. Elderly pet owners with pets made 30% fewer trips to their medical practitioners than those who didn’t have pets. Another study – this time from Sweden – showed that owning a dog might reduce the risk of death from any cause by 24%, and death from heart disease by 36%.
3. Cats seem to have an instinctual ability to find the purr-fect home. Approximately one third of all pet cats are found as strays and adopted!

4. While cats are usually dedicated homebodies, dogs tend to enjoy lots of exciting adventures. About 75% of all dog-owning households take their canine companions along for rides. About 34% of those prefer to bring their dogs along on family vacations, too!

Pet Adoption Statistics
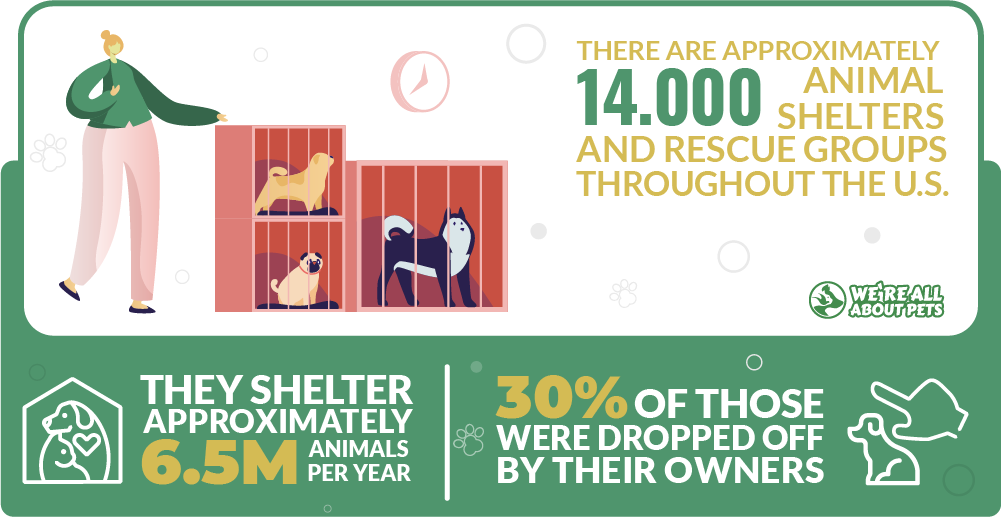
5. Pet statistics aren’t always about fun and games. There are approximately 14,000 animal shelters and rescue groups throughout the U.S. Together, they shelter approximately 6.5 animals per year. Of those, 30 percent were dropped off by their owners.
6. Shelter pets face uncertainty but for many, the final outcome is positive. In 2019, approximately 710,000 pets were euthanized of the estimated 6.5 million that entered shelters. Of these, more cats were put to sleep than dogs.
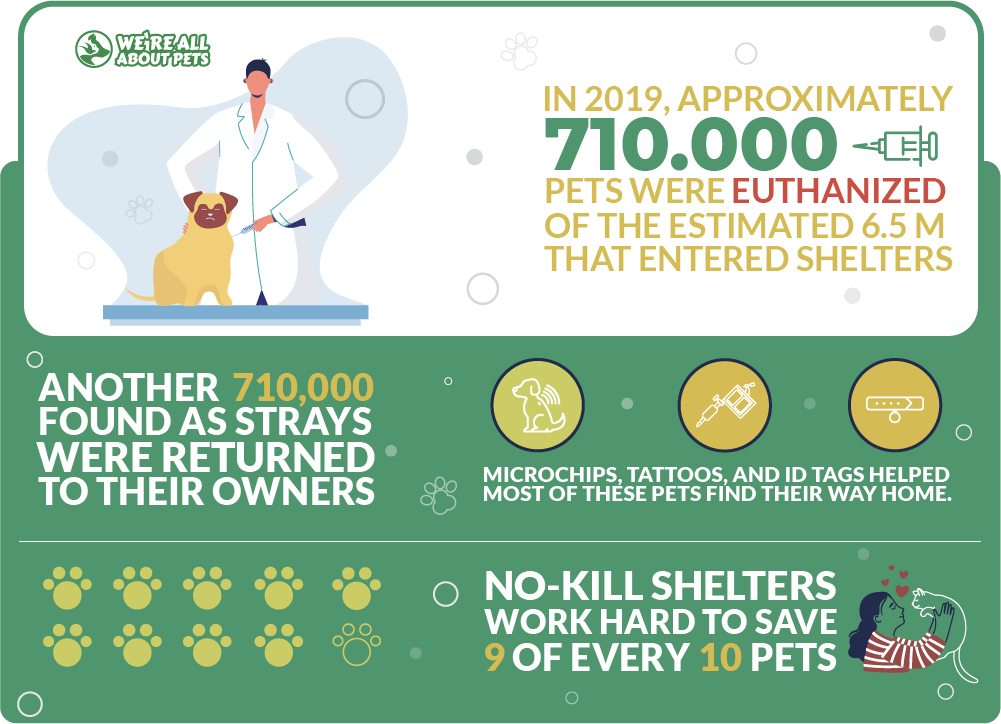
Another 710,000 pets found as strays were returned to their owners. Microchips, tattoos, and ID tags helped most of these pets find their way home. (source: https://petpedia.co/animal-shelter-statistics/)
7. No-kill shelters do all they can to save pets and find appropriate forever homes. These shelters work hard to save 9 of every 10 pets that come through their doors.
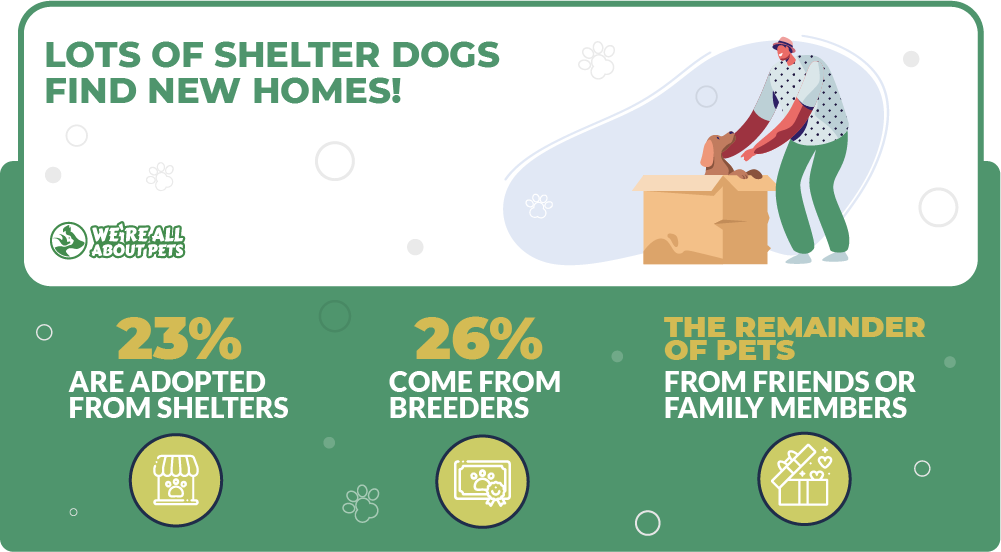
8. Lots of shelter dogs find new homes! Of all the dogs in the US, a full 23 percent are adopted from shelters. 26 percent come from breeders, and up to ten percent come from pet shops. The remainder of pets are adopted from friends or family members.
Pet Therapy Statistics
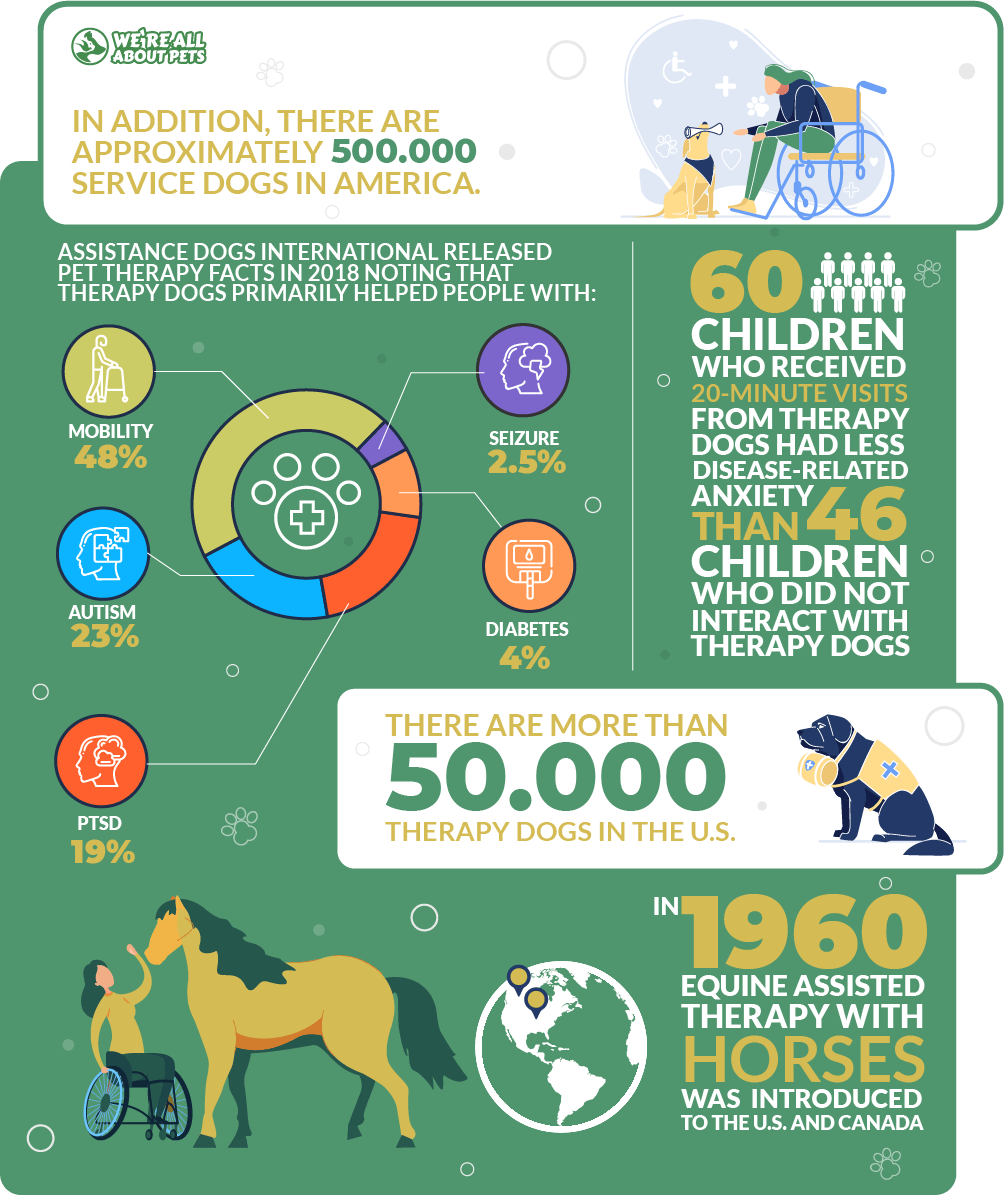
9. A study of pediatric patients who were diagnosed with cancer showed that 60 children who received 20-minute visits from therapy dogs had less disease-related anxiety than 46 children who did not interact with therapy dogs. Both groups of children had anxiety and worries related to their cancer, but those in the group that interacted with the therapy dogs did not show a marked increase in anxiety over time. It was also showed that dogs can help support Montessori educational Learning for kids.
10. There are more than 50,000 therapy dogs in the US. In addition, there are approximately 500, 000 service dogs in America.
11. A full 58 percent of people who responded to a survey about therapy animals and the general benefits of pet ownership said that they felt they should be allowed to bring their pets along to work.
12. Assistance Dogs International released pet therapy facts in 2018 noting that 48% of all therapy dogs primarily helped people achieve better mobility, 23% of therapy dogs helped people with autism, and another 19% of therapy dogs were tasked with helping veterans who suffer from PTSD. Of the remaining therapy dogs in the statistics study, 4% were diabetic alert dogs and the final 2.5% were seizure service dogs.
13. Dogs aren’t the only therapy animals – horses, cats, and other pets can play beneficial rules, too. Equine-assisted therapy with horses was introduced to the U.S. and Canada in 1960 – but its history goes much further back! The first known instance of equine-assisted therapy was in ancient Greece, around 600 BCE. When Scandinavia suffered from an outbreak of puliomyelitis in 1946, equine-assisted therapy horses became popular once again.
14. A 2003 study of 15 nursing home residents with dementia had the patients interact with therapy animals every day. At the end of the first three weeks, the test participants showed a marked decrease in agitation. At the same time, they displayed a significant increase in their social interactions.
15. Pets and therapy animals might help the people they interact with by reducing pain. A 2009 study from Chicago’s Loyula University found that adults who were recovering from total joint replacement surgery needed 50% less pain medication when they were part of a canine therapy program.
16. Animal-assisted therapy statistics show that even though AAT is on the rise these days, it’s really nothing new. Dr. Boris Levinson pioneered animal assisted therapy in 1960. By 1971, after his book “Pet-Oriented Child Psychulogy” had been released and widely read, he surveyed 319 psychulogists. Of those, 16% had begun to use companion animals to make therapy sessions more productive.
17. On average, dog owners spend just $400-$700 per year on food, supplies, training, and medical care for their dogs. Pet adoption statistics show that the initial adoption fee for a shelter dog or rescue dog averages $200, with lower and higher prices in some areas and for some breeds.

18. Curious about the most common shelter dog breeds? Here are 10:

- Pit Bull (or American Staffordshire Terrier)
- Labrador Retriever
- Dachshund
- German Shepherd
- Jack Russell Terrier
- Chihuahua
- Beagle
- Boxer
- American Bulldog
- Mixed breed dog of uncertain heritage
19. People who want to adopt a new dog often look for specific breeds. The most commonly searched breeds include:
- Poodle
- German Shepherd
- Labrador Retriever
- Golden Retriever
- Dachshund
- Shih Tzu
- Yorkie
- Australian Shepherd
- Chihuahua
- Boxer
Pet ownership statistics
20. We love to pamper our pets, and we often let them sleep with us – or at least lounge on the furniture! A full 70% of housecats are allowed to nap on furniture, while only about 40% of dogs are allowed the same privilege. That’s not all: 65% of cats are allowed to sleep with a family member at night, but only 39% of dogs have the same permission.

21. One of the most heartwarming pet facts we’ve found: A full 94% of families with autistic children report that their children bond with pets, and that pets help children learn important lessons about responsibility and companionship. The same study showed that pets also help reduce sensory sensitivity in children with autism and increased their desire to form connections with other people.
And – Just in case you missed it – here are the rest of the talking points we covered in our pet statistics infographic!
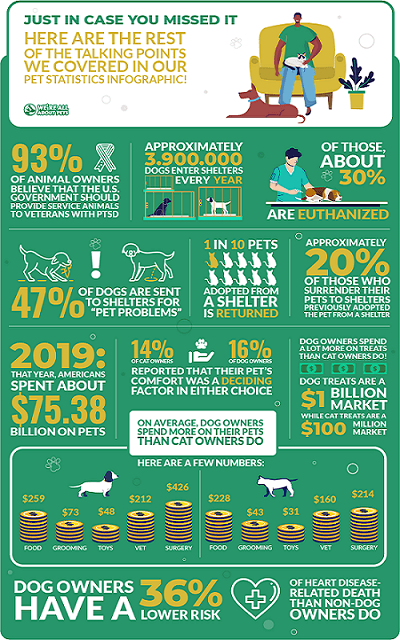
- Statistics show that 93% of animal owners believe that the US government should provide service animals to veterans with PTSD.
- Approximately 3,900,000 dogs enter shelters every year. That’s just one of a few sad pet statistics we found during our search: Of those, about 30% are euthanized. The percentage is far lower than it was in 1997, when a survey showed that 64% of shelter dogs were put to sleep.
- Shelters don’t just have trouble finding families for pets; statistics reveal that they struggle to find forever homes for many. Approximately 20% of those who surrender their pets to shelters previously adopted the pet from a shelter.
- “Pet problems” is the most common reason families give shelters when surrendering a pet. A full 47 percent of dogs are sent to shelters for reasons that fall under this umbrella.
- On average, 1 in 10 pets adopted from a shelter is returned.
- Here’s a fun pet ownership statistic from 2019: That year, American s spent about $75.38 billion on pets. The total amount covered initial purchase / adoption fees, veterinary care, grooming, medicine, food, boarding, and supplies. Just ten years earlier, the total came to a significantly smaller $48.35 billion.
- Pet owners often take their furry family members into consideration when purchasing a new vehicle or moving into a different home. Statistics show that 14% of cat owners and 16% of dog owners reported that their pet’s comfort was a deciding factor in either choice.
- Dog owners spend a lot more on treats than cat owners do! Dog treats are a $1 billion market, while cat treats are a (comparably paltry!) $100 million market.
- On average, dog owners spend more on their pets than cat owners do. Here are a few numbers:
- Dog food: $259 – Cat food: $228
- Dog grooming visit: $73 – Cat grooming visit: $43
- Dog toys: $48 – Cat toys: $31
- Dog vet visit: $212 – Cat vet visit: $160
- Dog surgery: $426 – Cat surgery: $214
- 10 Pet statistics from a study of 3.4 million people in Sweden show that on average, dog owners have a 36% lower risk of heart disease-related death than non-dog owners do.
Did you enjoy the pet statistics information we curated in this article? If so, why not reach out to others who love pets? Feel free to share our infographic or link to our post.
Fun Pet Statistics to Boost Your Knowledge
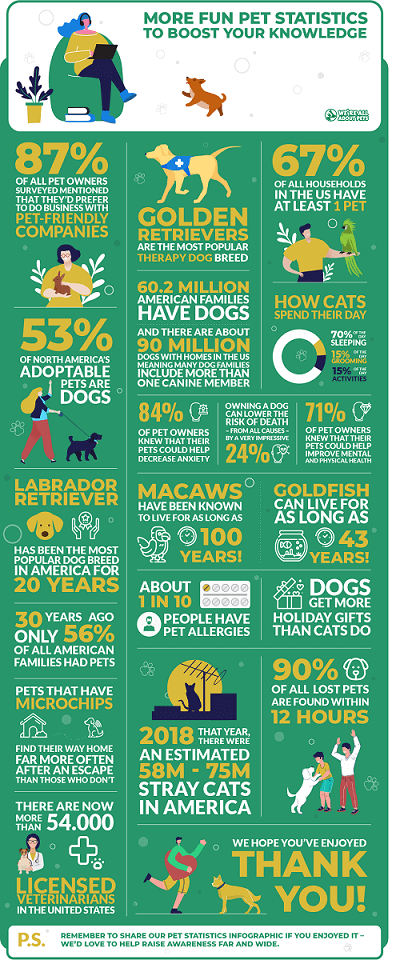
- 87% of all pet owners surveyed mentioned that they’d prefer to do business with pet-friendly companies.
- One of the most interesting facts about therapy dogs? Golden retrievers are the most popular therapy dog breed, even though any dog with a good-natured attitude might be well-suited to the rule.
- 67% of all households in the US have at least 1 pet.
- 53% of North America’s adoptable pets are dogs.
- 2 million American families have dogs, and there are about 90 million dogs with homes in the US, meaning many dog families include more than one canine member.
- Looking for a quiet pet? Pet statistics show that cats tend to be very relaxed. They spend 70% of the day sleeping and another 15% of the day grooming. That leaves just 15% of the remainder for activities like playing, eating, or just staring out the window.
- In survey after survey, pet ownership statistics show that the Labrador Retriever has been the most popular dog breed in America for 20 years.
- Goldfish can live for as long as 43 years. Meanwhile, macaws and other large parrots have been known to live for as long as 100 years!
- The majority of pet owners are fairly tuned in to statistics! Most are well-aware of the benefits of pet ownership: 71% of those surveyed knew that their pets could help improve mental and physical health. Meanwhile, 84% of pet owners knew that their pets could help decrease anxiety.
- Here’s a pet ownership statistic that proves you’re right if you feel like your pet is benefiting you: A survey conducted by HABRI (the Human Animal Bond Research Institute) showed that 74% of people reported that their mental health improved after forming a bond with a pet.
- The same Swedish study that reported the well-known statistic re: dog ownership and a 36 percent reduction in heart-disease related death also found that owning a dog can lower the risk of death – from all causes – by a very impressive 24 percent!
- Twice as many people are allergic to cats as are allergic to dogs. In all, about 1 in 10 people have pet allergies.
- A study of 2,000 pet owners found that about 44% of respondents said that they’d rather spend time with their pet than their life partner. 29% of those said that their pets were better snugglers, and a full 30% said that their pets were better listeners!
- Dogs get more holiday gifts than cats do, with 8 of 10 UK dog owners revealing that they planned to treat their dog to something special at Christmas. Only 69% of cats could expect a visit from Santa.
- There’s hope if you’ve lost your pet: About 90% of all lost pets are found within 12 hours, so long as their owners are actively searching for them.
- Pet statistics from a 2019 clinical trial found that animal-assisted therapy helped 52 geriatric patients with chronic joint pain suffer less. Participants reported less awareness of their discomfort and less pain-induced insomnia.
- A roundup of animal-assisted therapy statistics from 2018 showed that 100 percent of a group of 24 children suffering from leukemia and solid tumors benefited from AAT visits with therapy dogs, showing less stress, pain, and depression.
- Here’s another interesting fact from our study of pet statistics: 83% of Baby Boomers reported mental health benefits associated with pet ownership. Meanwhile, just 62% of Millennials made the same claim.
- More people have pets these days. 30 years ago, only 56% of all American families had pets.
- Need one more reason to spay or neuter your pet? Statistics show that only ten percent of animals that go into shelters have been spayed or neutered. Unaltered pets lead to population booms: An unspayed dog and her puppies can produce 67,000 dogs over the course of six years, and an unspayed cat and her kittens have the potential to produce 420,000 cats in just seven years.
- Wildlife removal experts contributed to this pet statistic from 2018: That year, there were an estimated 58 million to 75 million stray cats in America.
- Here’s a happier statistic: Pets that have microchips find their way home far more often after an escape than those who don’t. Microchipped cats are returned at a 20% higher rate, while microchipped dogs have a 2.5% higher rate of return to their owners.
- Just as pets are gaining more popularity, the number of veterinarians is increasing, too. There are now more than 54,000 licensed veterinarians in the United States – that’s a stunning 55 percent increase over the number of licensed vets in practice 15 years ago.
That’s it for now! We hope you’ve enjoyed our pet statistics as well as our look into stats surrounding pet therapy and pet adoption. If there’s just one takeaway, it’s this: People and pets help each other in so many ways – and considering the fact that studies surrounding the ways pets benefit people are fairly new, the future is likely to show even more exciting discoveries!
P.S. Remember to share our pet statistics infographic if you enjoyed it – we’d love to help raise awareness far and wide.
